My DynaList has been especially SLOW - lately on every platform, -so I’m guessing it is that I just have too much stuffed into one File. I am making an Archive File and moving stuff out of my Home file to make it not such a huge file.
The OMPL file is isometric to a file-system structure. There are apps that let you see where you are using all your disk space. I was wondering if there would be a way to cobble together a way of doing this for an OMPL file.
Here are some images of apps that visualize and make it easy to find where the most are taken up in your disk space.
Imgur album with examples: https://imgur.com/a/HCi3xai
Any ideas? Has anyone created something like this before, or will I have to make it?
It’s not using disc space. It’s a tiny file on the disc. The issue is that it renders that file into RAM as a boatload of HTML5/CSS/javascript/embedded external images compiled with the Chromium V8 rendering engine and accelerated with GPU VRAM. You ran out of RAM and your computer is choking.
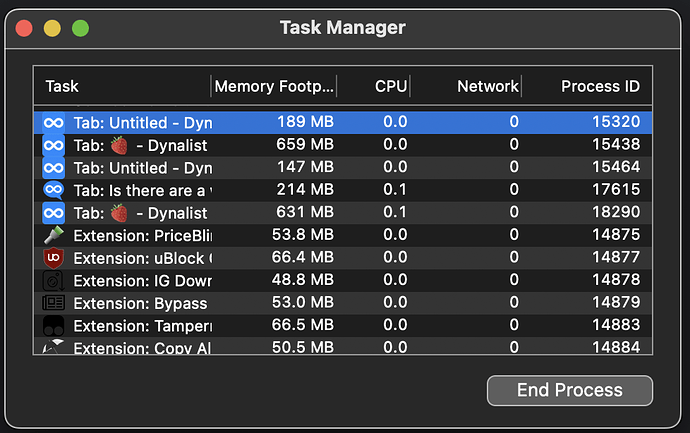
Open each document in a new tab in Chrome, and go to More Tools > Task Manager to see how much Memory Footprint each document renders to.
Your options are:
- Buy more RAM. Quick and easy fix, if feasible.
- Split the document in half down the middle, then open those two documents in two tabs to see which one has the Memory hogging nodes. Split it again, repeat. Eventually you can narrow down to the nodes that are so RAM-hungry. But, usually a simple split down the middle fixes everything. Usually you’ll just find that all nodes are equally RAM-hungry you just have too many of them rendering in one tab.
-
Wouldn’t 32 GB of RAM w/ a 3.6 GHz 8-Core Intel Core i9 be enough for Dynalist either on Chrome or the Desktop App? It could be something else messed up on my system that exacerbates it or visa versa. Hmmmmmm
-
Also the Chrome Task Manager Memory Footprint is not a reliable metric because it is variable over time. I click to open something and it jumps up but then back down, I open something else and the same thing happens. I don’t know what numbers to look at or compare. Having every single thing open isn’t that much more MB than just Chrome by itself.
I guess I could try to watch for the highest number each reaches before returning down to the same value and then do a binary search as you suggested. This seems like it’ll take a looooong time tho and be inaccurate 
Either way this is very frustrating so I thank you for trying to help. I wish it was like when I first tried it out. The devs probably aren’t trying to optimize that much anymore so I may have to try many routes and make it a big project just to shave off the 5-20+ second wait times.
I wish it was like when I first tried it out.
It can be, but you’ve gotta split the document in half down the middle, into two documents. Maybe even split it a second time into 4 documents.
I don’t know why exactly documents hit such a performance wall at a certain length. Maybe there is some O(n^2) computation somewhere, where n is the number of nodes in one document. But a lot of people have the exact same complaint as you. And the solution has always been a split down the middle.
I assume you exhausted all other possibilities (i.e. opened the document in Firebox incognito mode to see if its fast there)
Thanks. I guess that’d be doable as using the PARA model organizing things like:
-Home
----Projects
----Areas
----Resources
----Archives
So I could split it into those 4 PARA documents. And maybe also a document for an inbox. Or does each doc have an inbox? I’ll check the docs.
Could/would there be any downsides? Like breaking bookmarks, links, or anything else?
Any recommendations on how to this do this the best way or ideas for easily moving nodes between documents? Can I do it with Shift+Cmd+M like normal? I’ll check the help docs for now.

